Data formats and online quick-look
Details on the FITS file structure are given in a separate document. Download
it here: pdf
Users are provided with two different tools in order to inspect the data produced by the TPB.
If writer is MANAGEMENT/FitsZilla
When acquiring FITS files through a schedule, there is a tool available for the almost-realtime quick-look of the saved data.
Open an internet browser and visit the page “http://XXX.XXX.XXX.XXX:8080”. The address corresponds to the discos-manager workstation. Otherwise if you are directly connected to discos-manager through ssh you can simply visit “http://localhost:8080”.
The last completed FITS file (i.e. the most recent subscan carried out) will be displayed with some ancillary information.
Note
The program automatically identifies the recorded sections and plots them all.
If writer is MANAGEMENT/Point or MANAGEMENT/CalibrationTool
When data are acquired – both manually or through a schedule – using the Point or CalibrationTool writers, the quick-look must be performed using the CalibrationToolClient. Open a terminal and use the command:
$ calibrationtoolclient [componentName]
where componentName is either MANAGEMENT/Point or MANAGEMENT/CalibrationTool. A graphic window will appear. Its content is given in the following figure.
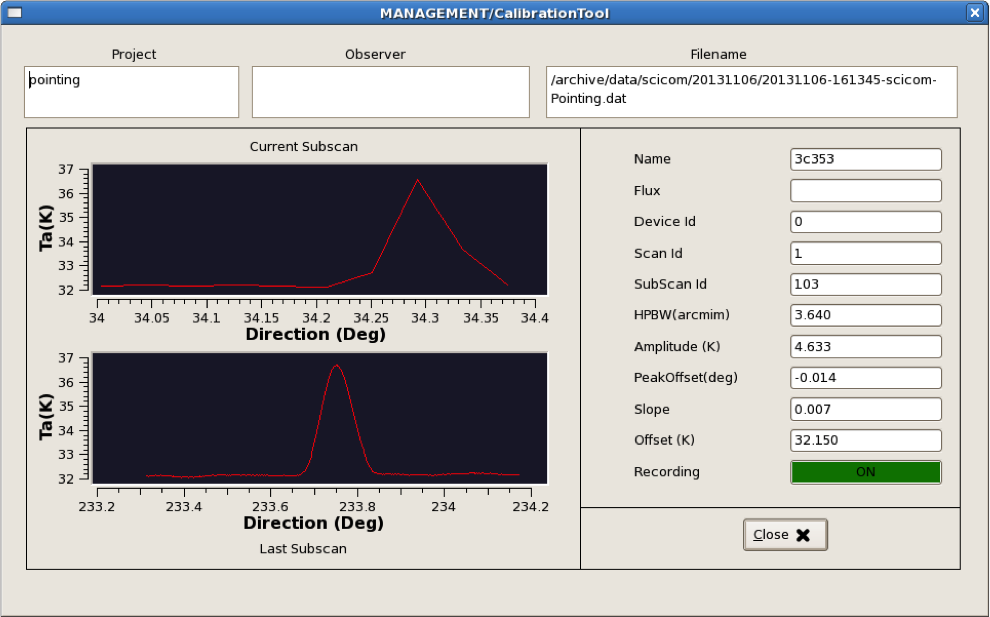
In this client, the subscan currently being acquired is shown in real-time (upper plot), even if in a low-res version. Under this display, the last completed subscan - in its full sampling - is shown.
Note
You can also launch the calibrationtoolclient using the icon provided on the euser desktop, without having to open a terminal, etc.